If you want to be a successful trader, you must understand price action.
In this way, you can take those trades that you believe in, and from that, you can earn money in the stock market.
To build this trust and earn money, I am going to tell you the secrets of Price Action in English.
Which will help you trade more successfully and make you a better trader.
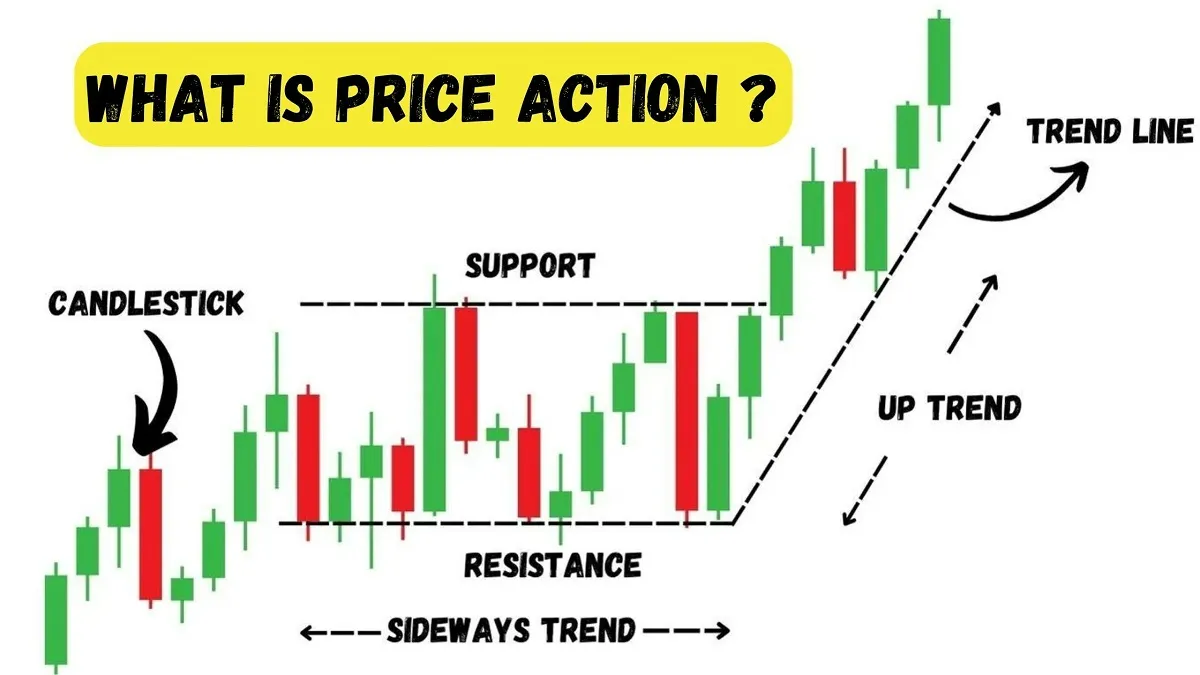
What is price action in the share market?
Price Action technical analysis One of the most important aspects is to trade.
It can predict whether the stock price will rise or fall, whether the momentum will increase or decrease, etc.
If you do not know what is price action, then there are high chance that you in the market a successful trader cannot become
The biggest use of price action is that you can know what is going to happen in the market just by looking at the price. From this, you will be able to understand what is price action.
Indicators are not used in price action, because all the indicators are created from the price.
Let’s know why.
Most of the price action indicators that are popular like,
And so on.
Price Action और Indicators
These are all lagging indicators, that is, these indicators use the previous price as an input.
Which gives you a signal to go in or out, but most of the time, the chart has already started going up or down.
This is the basic reason why price action is such a powerful tool. Because it can help you make decisions in real-time.
Like indicators, there is no delay in getting the signal, no latency, and moment-by-moment trading can be done at the same time.
Now, I’m certainly not saying never to use indicators or other technicals.
Indicators can 100% help you make unbiased decisions while trading. When they are analyzed with price action.
How does price action work?
Price action is the movement of the price which we see on the charts be it candlestick charts or other charts.
As the share price moves up or down, so does the movement of the price on the chart.
All this is done using mathematical equations, which we do not need to learn.
How many patterns are there in price action?
If you want to know the best price action strategy, then you can watch this YouTube Video. In this video price action patterns in English are well explained.
How to learn price action?
Price action is not an indicator or a pattern, it is a mixture of many other technicals.
There are many other technicals involved in price action.
After learning these you can start trading with price action.
After learning the below-given technicals, you can learn price action.
What are the types of Price Action?
There are 2 types of price action in the stock market.
The first one is when the new trader starts his trading, then he starts trading with the help of candlesticks, indicators, etc. so that he can do trading easily.
Second, the person who has become experienced in trading in the stock market, then he does trading only by looking at price action, movement, chart, and pattern.
Candlestick
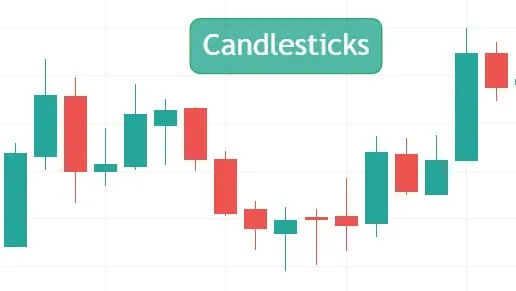
By looking at the candle stick, you can find out what movement has happened or is going to happen in the stock at that time, we can also call it candlestick price action.
candlestickTogether, different patterns are formed, which we call candlestick patterns.
As an example,
And so on.
With the formation of these candlestick patterns, we can find out what is going to happen in the market.
For example, whether the trend in the market will go up or down, whether to buy or sell the stock, etc.
With this, you can also create your candlestick price action strategy.
Support and Resistance
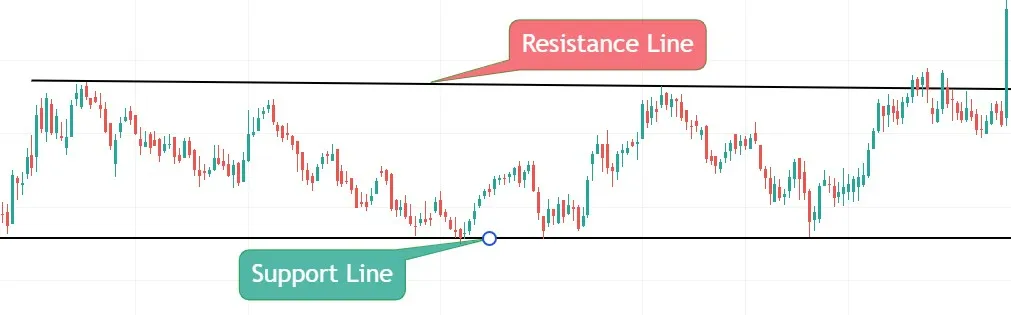
Support and Resistance These are the levels on the chart, where the price comes and stops.
From these levels, we get to know what will be the direction of the market. These are price action support and resistance levels.
Support
Where the prices come down from above. This prevents the price from going down.
Here there is a possibility to sell if the price goes below the support.
Resistance
In this, the price rises from the bottom. This prevents the price from going up.
If the price breaks the support and goes up, then there is a possibility of an uptrend in the market.
Chart Pattern
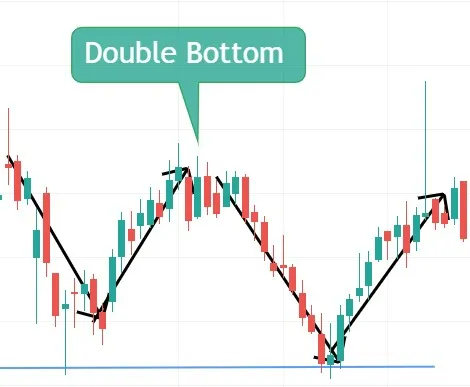
With the help of candlesticks or other technical, some shapes are formed on the chart, which we call chart patterns.
These chart patterns are formed over a long period of time.
With the formation of these chart patterns, we can predict the direction of the market.
Price Action Chart Patterns like,
- Double Top / Bottom
- Head & Shoulder
- Rounding Bottom
And so on.
Demand और Supply
Price Action Demand and Supply It means how many Buyers and Sellers are there at the price of a share.
Supply
When the price on the chart touches any one level and repeatedly goes down with resistance, we call it Supply.
Demand
When the price on the chart touches any one level and repeatedly takes support and goes up, we call it Demand.
Trend
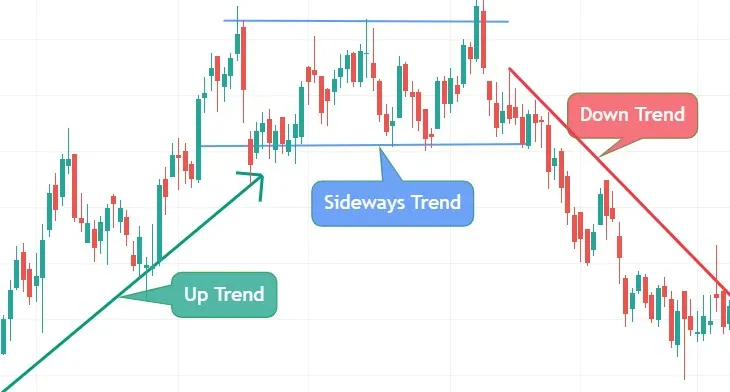
Markets always move in trends. The one who trades with the trend has less loss in the stock market.
Trend means the direction of the market. From this, we get to know when we have to buy shares, sell, or take trade or not.
There are 3 main trends in the stock market.
- Up Trend
Which means the market is going in an upward direction.
- Down Trend
That means the market is going in a downward direction.
- Sideways Trend
This means the market is neither going up nor down, the market is going in a range.
Trendline
When the market goes up or down, it does not move in the same range.
With the help of a trend line, we can know the direction of the market.
With the help of this Price Action Trend Line, we get to know the support and resistance of the trend.
Breakout और Breakdown
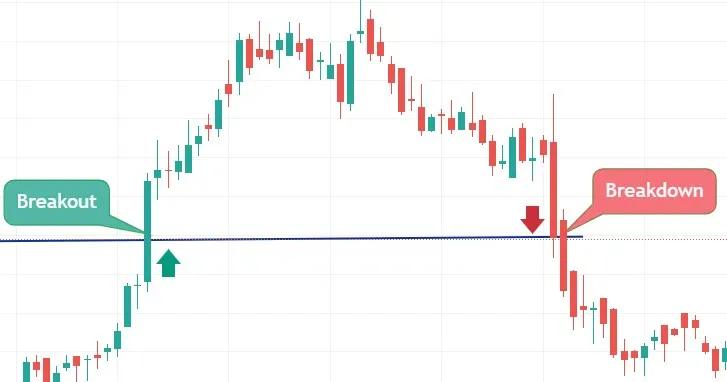
Price Action Breakout and Breakdown The words are often used interchangeably, but they have very different meanings.
Breakout
When the price comes above the bottom and goes above the Resistance Line, then we call it Breakout.
Breakdown
When the price moves below the support line after coming down from above, then we call it a down.
Volume
VolIt shows how many shares have been traded by buyers and sellers on that day.
If there is more buying in the market then the volume increases which is shown by the color.
If there is more selling in the market then the volume increases which is shown by red color.
Price Action Trading Book
Price Action Trading Book Written by Sunil Gurjar, one of the biggest traders in India.

Those who are new to the stock market or have been around for a few months can learn price action by reading this price action book in English.
Conclusion
Price action is a part of technical analysis, which is very important. Other technicals in technical analysis are based on price action.
That means you have to give more importance on learning price action than any other technical.
Price action is one of the initial aspects of share market which you have to learn, after learning this you can start earning money from stock market.
If you liked the article What is price action trading then share it with your friends.
Read this Article in Hindi :- Price Action – एक सफल ट्रेडर बनने के लिए यह सीखना हैं बहुत जरुरी।
Read this Article in Marathi :- Price Action – यशस्वी Trader बनण्यासाठी हे शिकणे आहे खूप महत्वाचे.
FAQ
What is price action?
Price action is one of the most important aspects of technical analysis for trading.
It can predict whether the stock price will rise or fall, whether the momentum will increase or decrease, etc.
Is Price Action Trading Best?
The biggest use of price action is that you can know what is going to happen in the market just by looking at the price.
Because of this you do not need to learn other techniques. Learning price action is everything for a trader.
What is Price Action Trading?
When we use only price action for trading then it is called price action trading.
In this, trading is done without the help of any indicator or other technical. Only price action is used.
How long does it take to learn price action?
If you practice all the lessons given in this article, then you can learn Price Action Trading in 3 months.
Which indicator is best for price action?
MACD, RSI, Stochastic, Bollinger Band, Moving Average, Super Trend, ADX, VWAP These indicators come in handy while doing price action analysis.